Guests are now able to walk to their seats inside the cars of the new transport ride - here’s a view through the cars roof:
Fortunately it was possible to reuse the same waypoints tools I created for flat rides.

We thought about how to display the parks finances this week. We wanted to have something that’s a bit less overwhelming than a big table of numbers and that lets you quickly see how you’re doing. It needs some more polish and isn’t complete yet but here’s what we came up with:
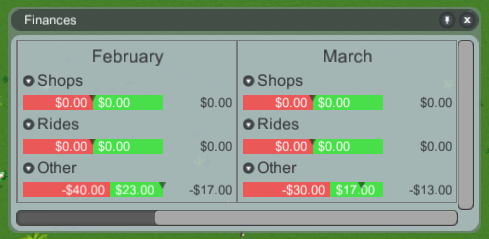
Your parks expenses/income is grouped into these categories. Each category has a colored bar showing the expenses/income of that category. The little black arrow marks the expenses of the previous month - if it’s in the green area it means you’re doing better this month than last, if it’s in the red you’re doing worse.
The categories can be expanded…
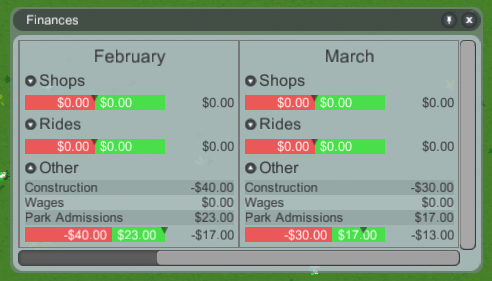
…so if you’re interested in the detailed numbers they’re all there.