This week has mainly been more smaller fixes and improvements. One of the more notable changes I guess is that guests don’t spawn randomly anymore (was placeholder code), but based on the attractions in your park and the park rating. Since we’re still using placeholder values for determining the attractivity of a ride it currently spawns way too many guests though. I tried to hold off on doing any game balancing as long as possible, but I think it’d be a good idea to at least start with it soon since we’ve got a couple of systems implemented now that need to work together. We won’t get the balance right on the first try anyways and it’d help to get a bit of a feeling for it.
The new audio tools in Unity 5 are a big improvement over the ones in 4, but they’re still pretty basic. Gordon linked me to Fabric, a huge extension for Unity’s audio functionality. It should do everything we need out of the box, so I’ve added it to our project this week.
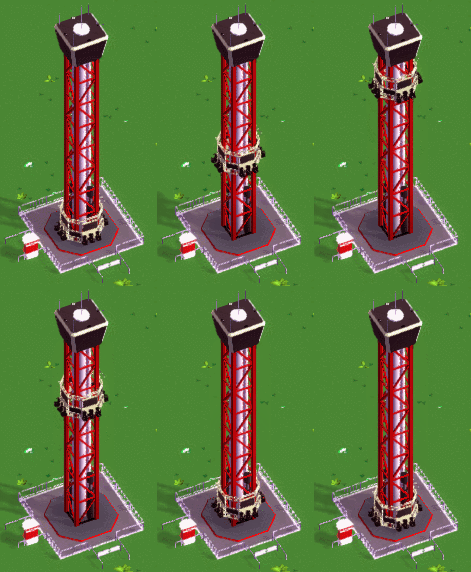
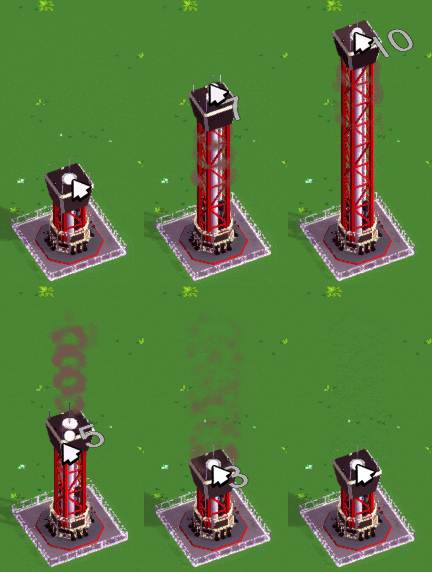
The Observation Tower that Garret created during last weeks livestream is in the game now:
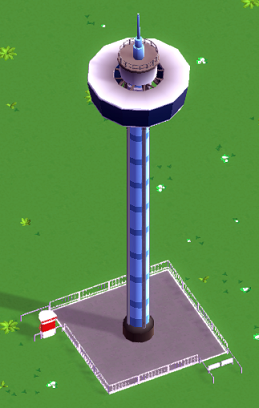
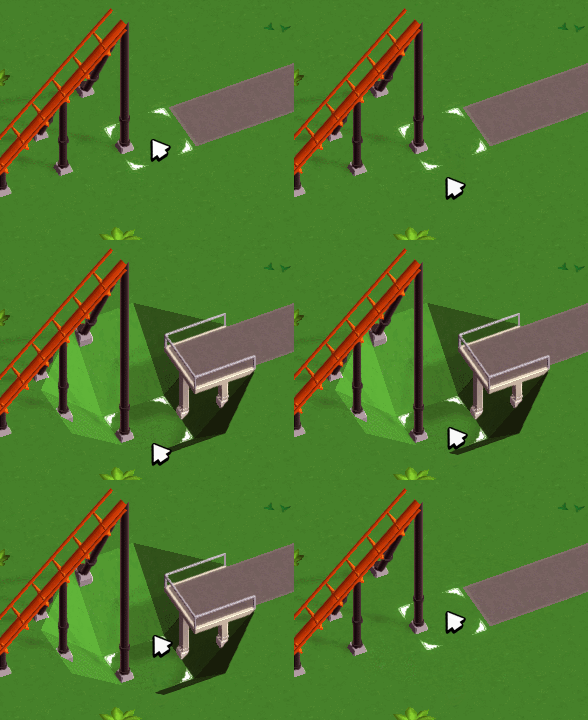
Building it works just like last weeks drop tower.
And here’s the timelapse of the stream:
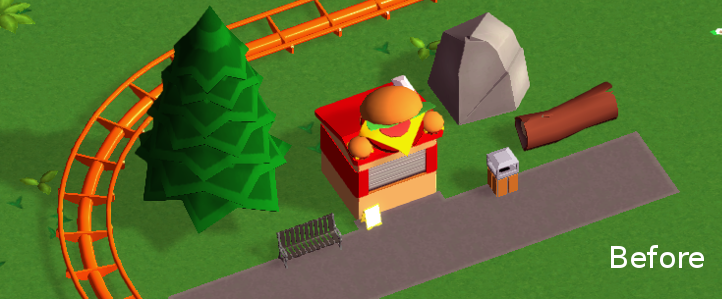
Getting the wooden coasters to look good is probably the hardest out of all rides and I was never really satisfied with them. Here’s an old screenshot from August last year:
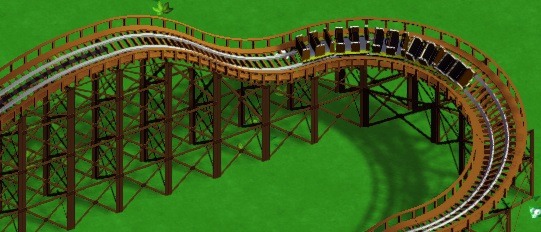
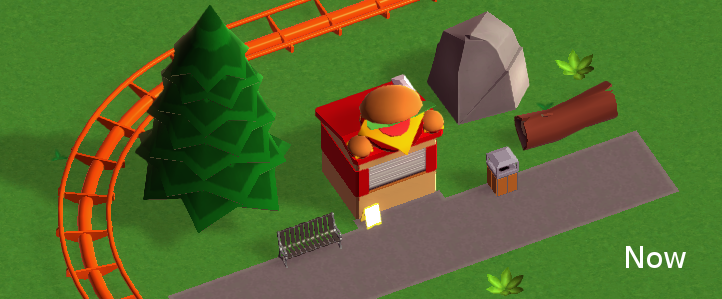
And after a bit of work this week they now look like this:
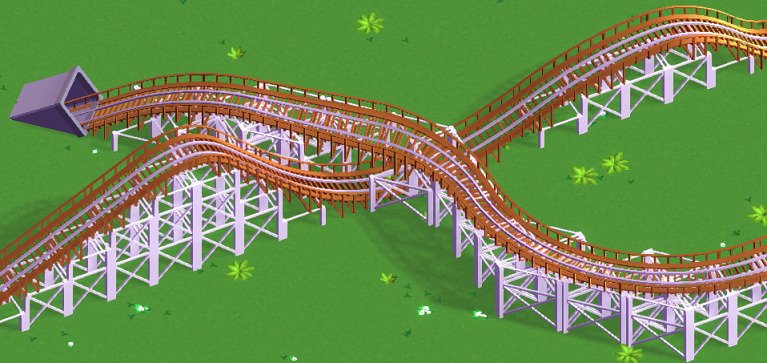
The main issue with the old supports was that they were just textured quads which made them look more like they’re made out of paper than wood, especially when viewed from certain angles. They’ve been replaced with real geometry (paceholder art, by the way) which automatically makes it look better (but we got to keep an eye on performance - seems fine so far though). Their placement is also more precise and they react to terrain changes like the steel supports. There are still some issues but I think it’s going in the right direction now.

